Can a Word Place You on a Map?
What a word can and can't say about where someone is from: dialects as bundles of variables, why isoglosses don't behave like borders, moving from one answer to a likelihood, a four-step mini study, and four reasons a person won't match the map.
- 8 min
- 9 steps
- 3 questions
- Lesson 7 of 36
In this lesson
- The map is made of variables
- Word Cabinet: six clues, no passwords
- Why isoglosses refuse to behave like borders
- Worked example: from answer to likelihood
- Use M-A-P-S
- Four reasons a person may not match the map
- Practice: make a map that admits what it does not know
- Rule of thumb
Open alongside this lesson
-
Determining Location by Accent (opens in a new tab)
Start here for bag, soda/pop/Coke, and sofa/couch/davenport as regional clues - and for the limits of the guessing game.
-
How America Talks (opens in a new tab)
Hear a larger tour of American regional vocabulary and pronunciation before trying the field exercise.
-
Regional Distributions (opens in a new tab)
Compare mapped survey responses instead of treating a viral dialect quiz as ground truth.
-
Variationist Methods and Concepts (opens in a new tab)
Use this for variables, variants, communities, and the quantitative logic behind a dialect map.
Picking up where you left off.
A word can sometimes nudge a guess toward one region, but it cannot read a birth certificate. A speaker who calls a carbonated drink pop may be more likely to have ties to one set of places than a speaker who calls it soda or Coke. Yet that speaker may have moved, learned the term from family, adapted to friends, or simply chosen a less usual variant that day.
That makes regional language more interesting than a quiz result. It is evidence about communities, contact, and change - not an identity test.
Core rule: a dialect feature changes the odds; it does not name the person.
An A Way with Words conversation uses bag, soda/pop/Coke, and sofa/couch/davenport to show how vocabulary and pronunciation can support a rough regional guess 1. The examples are invitations to investigate distributions, not magic passwords. The show’s broader regional-language episode likewise treats American speech as a landscape of living local patterns 2.
The map is made of variables
A dialect is a patterned variety of a language. It includes vocabulary, pronunciation, grammar, and conversational practices. An accent is the pronunciation portion of that system. Everyone has both; the speech that sounds “neutral” usually means only “familiar” or “institutionally favored” to a listener.
Variationists turn an everyday contrast into something countable:
- A variable is a place where speakers can make more than one patterned choice, such as the general term for a carbonated soft drink.
- A variant is one option at that place: soda, pop, or Coke.
- A token is one observed instance from one speaker in one context.
- A distribution is how often variants occur across speakers, places, times, or situations.
- An isogloss is a line drawn to summarize where one feature is more common.
- A dialect region is inferred from several features whose distributions overlap substantially.
The open Essentials of Linguistics chapter on variationist methods emphasizes that socially meaningful variation is studied by comparing variant rates with speaker and context variables 3. A map therefore represents a dataset and a set of decisions: who was asked, how the prompt was phrased, how responses were grouped, and where a boundary was drawn.
Word Cabinet: six clues, no passwords
| Variable | Some recorded variants | What to notice |
|---|---|---|
| carbonated soft drink | soda, pop, Coke | A dominant regional pattern can coexist with minority answers. |
| upholstered seating | sofa, couch, davenport | Age and family history may matter alongside place. |
| carried personal bag | purse, handbag, pocketbook | The same object may be categorized differently by different speakers. |
| bag vowel | several pronunciations of the vowel before g | A sound can vary even when the written word does not. |
| small running waterway | creek, crick, other local terms | Pronunciation and word choice can interact. |
| glowing summer insect | firefly, lightning bug | A memorable contrast still needs survey evidence before mapping. |
These are variables to investigate, not a list of exclusive state words. DARE’s regional-distribution maps make the critical move from anecdote to evidence by plotting responses gathered through a documented survey tradition 4. Even a striking cluster usually fades at the edges rather than stopping at a state line.
Why isoglosses refuse to behave like borders
Political borders are created by law. Language boundaries emerge from interaction. A river, migration route, trade center, school system, industrial network, or settlement history may shape who talks with whom, but no single force controls every feature.
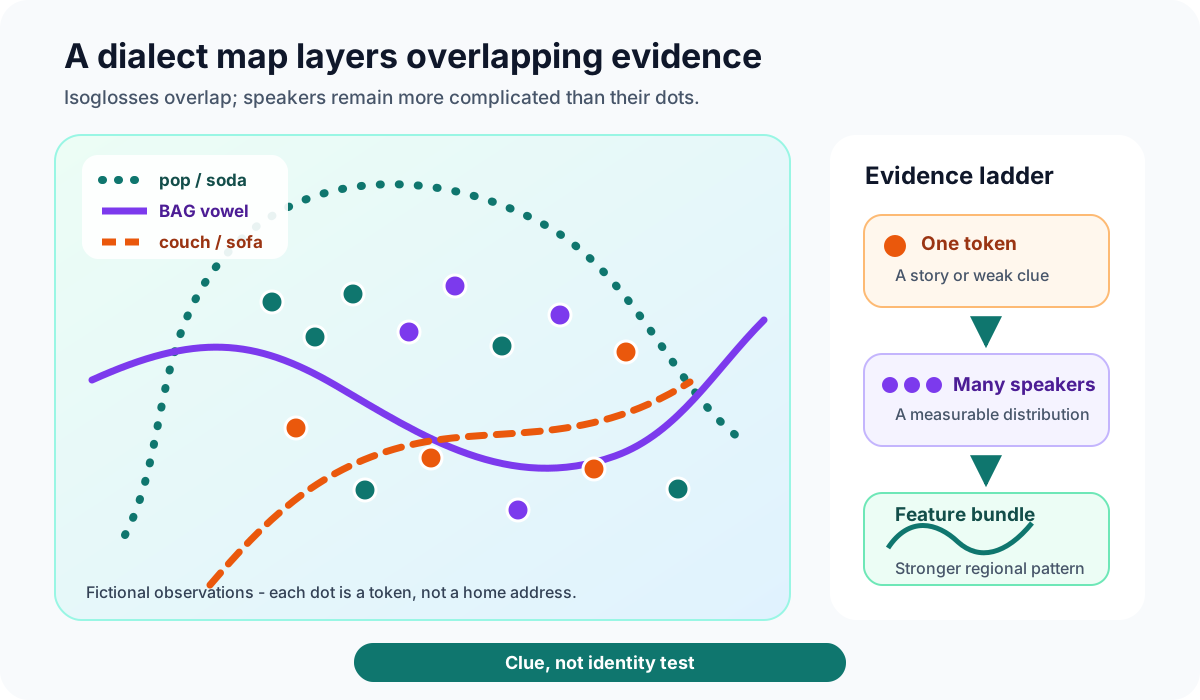
Imagine three maps laid on top of each other:
- Pop is frequent across a broad northern band.
- A raised vowel in bag clusters around part of the Great Lakes.
- Davenport appears among some older speakers in several scattered places.
The three lines do not match. Where two or three patterns overlap, a regional hypothesis grows stronger. Where they diverge, the divergence is information: perhaps the features traveled through different networks or are changing at different rates.
This is why a dialect map should use gradients, dots, or proportions when possible. A hard line can make a 51-to-49 difference look like a wall.
Worked example: from answer to likelihood
Suppose a careful fictional survey asks 100 comparable speakers in River County and 100 in Prairie County what they usually call a carbonated soft drink.
| Response | River County | Prairie County |
|---|---|---|
| pop | 72 | 24 |
| soda | 25 | 66 |
| Coke/other | 3 | 10 |
If an unknown speaker says soda, that answer fits the Prairie sample more often: 66% versus 25%. It is evidence favoring Prairie under this model. It is not proof. Twenty-five River speakers gave the same answer.
Now add two independent observations: the speaker usually says davenport, and their bag vowel resembles a pattern common in River County. The bundle may reverse the first guess. To combine it responsibly, you would need rates for those features and information about whether they are truly independent. Family vocabulary and place are often entangled, so simply multiplying percentages can exaggerate confidence.
The honest conclusion sounds like this:
“This three-feature bundle is more common in the River sample, but it cannot establish where the speaker was born or lives now.”
Notice the calibrated verbs: fits, favors, is more common. Avoid proves, reveals, and must be from.
Use M-A-P-S
Turn a language curiosity into a small study with M-A-P-S:
- M - Measure the same thing. Use a picture or neutral scenario so your question does not supply a variant. “What do you call this?” is better than “Do you say soda or pop?”
- A - Aggregate across speakers. One delightful family word is a story; many comparable responses can reveal a distribution. Record age range, places lived while growing up, and other metadata only with consent.
- P - Plot proportions, not stereotypes. Map the percentage using each variant. Preserve “other” answers rather than forcing them into expected boxes.
- S - State scope and uncertainty. Name the sample, date, prompt, missing groups, and plausible alternative explanations.
Mnemonic: Maps Are Provisional Summaries. The map is not the territory, and the dot is not the speaker’s identity.
Four reasons a person may not match the map
Mobility: A person can carry childhood speech into a new home or acquire local features later.
Networks: Family, schoolmates, coworkers, cultural communities, and partners do not all occupy the same geography.
Style: Speakers shift among variants depending on audience, task, formality, humor, or attention to speech.
Change: Age groups may distribute a feature differently. A historical map and a present-day survey can both be accurate for their periods.
Sampling adds another problem. An online voluntary quiz may overrepresent people who enjoy dialect trivia, have reliable internet access, or recognize the expected categories. Its polished result does not erase its recruitment method.
Practice: make a map that admits what it does not know
Choose one harmless object or situation with several names. Do not use a feature to mock, diagnose, or expose anyone.
- Write a neutral prompt and test it on two people for accidental leading language.
- With permission, collect at least 12 answers. Record only the broad background information you need.
- Keep exact responses before grouping spellings or near-synonyms.
- Make a table of counts and proportions. If you map them, use dots or shading rather than a hard border.
- Write one supported claim and one limit.
A sound result might be: “Eight of twelve participants with childhood ties to southern Wisconsin said bubbler; this convenience sample shows a local cluster but cannot estimate all Wisconsin speakers or show that the term is exclusive to Wisconsin.”
That last clause is not a weakness. It is the mark of someone reading dialect evidence well.
Rule of thumb
One token never earns a pin. Move from a word to a variable, from a person to a sample, and from a boundary to a probability. Regional speech becomes meaningful when several transparent evidence streams converge - and remains human when you leave room for every speaker to surprise the map.
Practice
Regional variants shift probabilities; mobility, family, age, style, and overlapping distributions prevent one token from proving an origin.
Practice
An isogloss maps a feature’s distribution. Different isoglosses rarely coincide perfectly, so dialect regions have fuzzy edges.
Practice
Comparable elicitation, broad sampling, transparent metadata, and honest uncertainty turn anecdotes into inspectable evidence.
Lesson complete
Nice work.
Sources for this lesson
- 1Determining Location by Accent. A Way with Words. verifiedSegment on what pronunciation can and cannot reveal about a speaker's geographic history. Cited at: segment overview.
- 2How America Talks. A Way with Words. verifiedSegment surveying regional word choices and the temptation to treat dialect clues as geographic certainties. Cited at: episode overview.
- 3Variationist Methods and Concepts. Essentials of Linguistics 2e, eCampusOntario. verifiedOpen textbook chapter on variables, variants, social patterning, and responsible interpretation of variation data. Cited at: variationist methods.
- 4Regional Distributions. Dictionary of American Regional English, University of Wisconsin–Madison. verifiedInteractive and static distributions for selected responses from the DARE field survey. Cited at: regional distributions.
Previous: Words with Two Faces: Contronyms, Polysemy, and Context