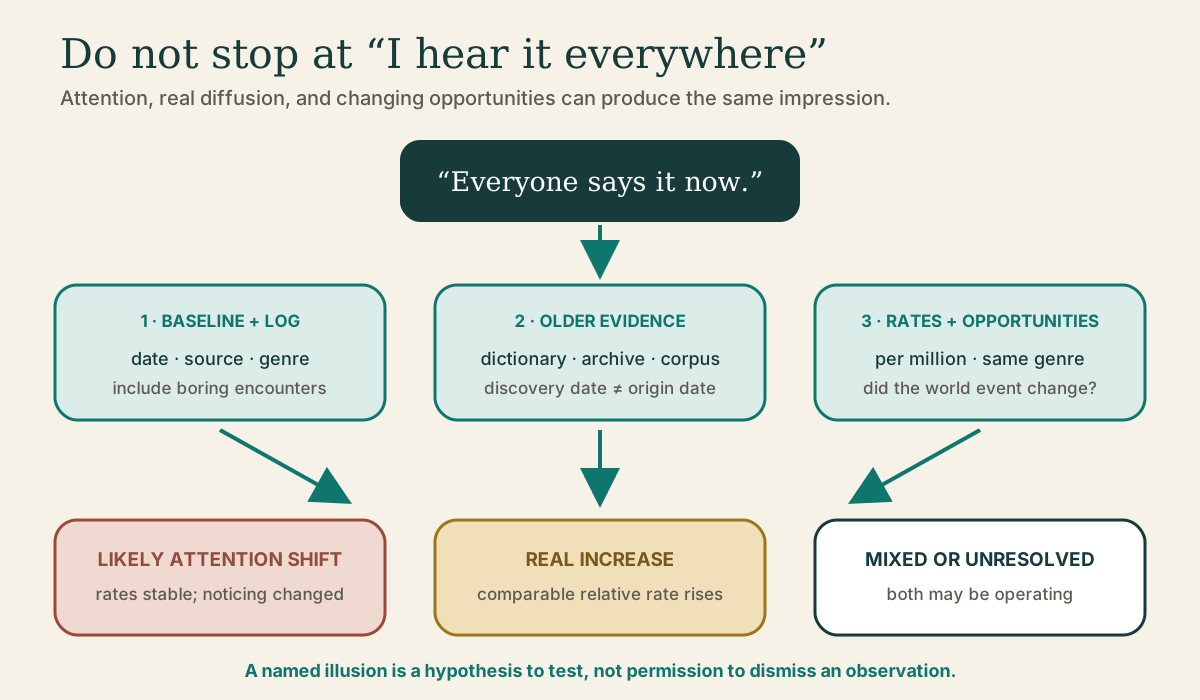
Frequency and Recency Illusions: Did Everyone Start Saying That?
Did everyone suddenly start saying that? Arnold Zwicky's frequency and recency illusions, 'suss out' and 'pick six,' four different counts people collapse into 'everywhere,' corpus and Ngram hygiene, and a seven-day noticing audit.
- 5 min
- 9 steps
- 3 questions
- Lesson 18 of 36
In this lesson
- Transcript lab 1: suss out
- Transcript lab 2: pick six
- Four quantities people collapse into “everywhere”
- What has actually been tested?
- Use BEFORE
- Corpus hygiene
- Practice: seven-day noticing audit
- Rule of thumb
Open alongside this lesson
-
Noticing Something and Then Seeing It Everywhere (opens in a new tab)
Hear the everyday inference, the proposed attention mechanism, and the hosts' important caveat about real usage waves.
-
Are We Indeed So Illuded? Recency and Frequency Illusions in Dutch Prescriptivism (opens in a new tab)
Follow claims from prescriptive publications into dictionaries and corpora, including the study's acknowledged measurement limits.
-
Google Books Ngram Viewer — Information and Usage Guide (opens in a new tab)
Check corpus composition, smoothing, case sensitivity, and OCR limitations before treating a curve as speech frequency.
Picking up where you left off.
You learn suss out on Monday. It appears in an article Tuesday, a meeting Wednesday, and a podcast Friday. Did the phrase suddenly surge, or did your attention acquire a new filter?
Linguist Arnold Zwicky named two related traps:
- frequency illusion: once you notice a form, it seems to occur unusually often;
- recency illusion: because you noticed a form recently, it seems newly invented.
These are useful hypotheses, not magic rebuttals. Sometimes a word really is spreading. The research task is to separate a changing world from a changing observer.
Transcript lab 1: suss out
The A Way with Words caller had gone years without noticing suss out and then encountered it several times. The hosts explain selective attention and confirmation bias: a newly salient form is easier to detect, and each detection strengthens the impression of a pattern 1.
Then the transcript adds the essential caveat. Journalists, shows, and social networks can amplify expressions, so a genuine vogue is possible. That sentence turns a cute cognitive label into a testable problem.
Transcript lab 2: pick six
A football viewer similarly reports that pick six seems to have exploded. The hosts name the recency and frequency illusions but also ask for the relevant statistics 2. Sports provide a perfect warning: more interceptions returned for touchdowns could create more opportunities for the term even if speakers’ preference did not change.
Count the linguistic rate and the world opportunity separately.
Four quantities people collapse into “everywhere”
- Token frequency: how many times the form occurs.
- Relative frequency: tokens divided by the size of the relevant sample, often per million words.
- Dispersion: how widely tokens are distributed across speakers, outlets, or documents.
- Salience: how strongly a token attracts and survives attention.
A phrase repeated fifty times by one viral account has high token frequency but low speaker dispersion. A rare form used once in each of forty communities may feel more established. An offensive or structurally odd form can be memorable enough to distort intuitive counts.
What has actually been tested?
Zwicky’s terms began as compact names for recurring metalinguistic misjudgments, not as a single laboratory theory 3. Van der Meulen later collected Dutch prescriptive claims about forms being new or frequent and compared sampled claims with dictionaries and corpus evidence. Most testable claims in that sample fit the proposed illusions, but the paper also documents hard choices: what counts as “recent,” which corpus represents usage, and what relative-frequency threshold is meaningful 4.
That nuance belongs in the lesson. A named bias does not remove the need to operationalize the claim.
Use BEFORE
- B — Baseline: What did you record before the form became salient? Usually nothing; admit that.
- E — Examples: Save every encounter with date, source, genre, and speaker—not only striking ones.
- F — Find older attestations: Search dictionaries, archives, and dated corpora for origin and earlier distribution.
- O — Opportunities: Identify external events or topics that could create more occasions for the form.
- R — Relative rates: Compare like-sized, like-genre samples with a denominator.
- E — Explain alternatives: Attention shift, true diffusion, topical burst, platform shift, or unresolved mixture.
Worked case: “everyone says literally now”
Baseline: the speaker has no earlier listening log.
Examples: recent emphatic tokens come mainly from short videos.
Find older: dictionaries and historical corpora show emphatic uses are not brand new.
Opportunities: the speaker recently began watching creators who favor the form.
Relative rates: compare the same platform and genres across time; a books corpus alone does not represent casual speech.
Explain: the recency claim is weakened, but a platform-specific frequency increase remains possible.
Corpus hygiene
A graph is not self-interpreting. Google Books Ngram counts strings in digitized books, not daily conversation. OCR errors, capitalization, changing corpus composition, smoothing, and words with multiple meanings can all bend a line 5. For speech, a spoken corpus or repeated local sample is better. For social media, platform access and recommendation algorithms complicate the denominator.
Practice: seven-day noticing audit
Choose one expression that feels newly common. For seven days, log both encounters and opportunities: what you read, watched, or heard. Then find one pre-2000 attestation and compare two equal-sized samples if possible.
Conclude with one of four labels:
- likely attention shift;
- documented increase;
- topical or platform burst;
- unresolved.
Rule of thumb
Your noticing date is not the word’s birth date, and your memorable examples are not a denominator. Log first, compare like with like, and allow perception and real change to coexist.
Practice
Noticing predicts increased detection, but genuine diffusion remains a competing explanation until frequencies are compared.
Practice
Personal discovery time is mistakenly treated as the form’s origin time.
Practice
Comparable denominators, genres, and time windows make a change claim testable.
Lesson complete
Nice work.
Sources for this lesson
- 1Noticing Something and Then Seeing It Everywhere. A Way with Words. 2019. verifiedFull segment transcript using suss out to explain the frequency illusion while acknowledging that genuine usage waves also occur. Cited at: full transcript.
- 2Football Jargon. A Way with Words. 2012. verifiedFull segment transcript in which a listener's impression that pick six has exploded prompts discussion of recency and frequency illusions and the need for actual counts. Cited at: full transcript.
- 3Arnold Zwicky. Illusions Postings. Arnold Zwicky's Blog. verifiedThe linguist who coined recency illusion and frequency illusion collects the original posts and later applications; this is a term-history source, not experimental proof of a single cognitive mechanism. Cited at: term history and collected posts.
- 4Marten van der Meulen. Are We Indeed So Illuded? Recency and Frequency Illusions in Dutch Prescriptivism. Languages. 2022. verifiedOpen empirical study testing claims about linguistic recency and frequency against dictionaries and corpora, while documenting limits in operationalizing both concepts. Cited at: methods and limitations.
- 5Google Books Ngram Viewer — Information and Usage Guide. Google Books. verifiedOfficial corpus documentation covering scope, OCR and metadata revisions, tokenization, search behavior, smoothing, and known analytical limits. Cited at: usage guide.