Gel Electrophoresis
Why DNA runs to the anode and separates by size, agarose versus polyacrylamide and which percentage to pour, TAE and TBE, sizing against a ladder on a log scale, stains and safety, and reading real gel problems: primer dimers, smears, extra bands, and empty lanes.
- 5 min
- 8 steps
- 4 questions
- Lesson 20 of 60
In this lesson
- Why size and not charge
- Agarose or polyacrylamide
- Buffers
- Sizing with a ladder
- Stains
- Reading a gel
- Uses
- What to take from this
Picking up where you left off.
Why size and not charge
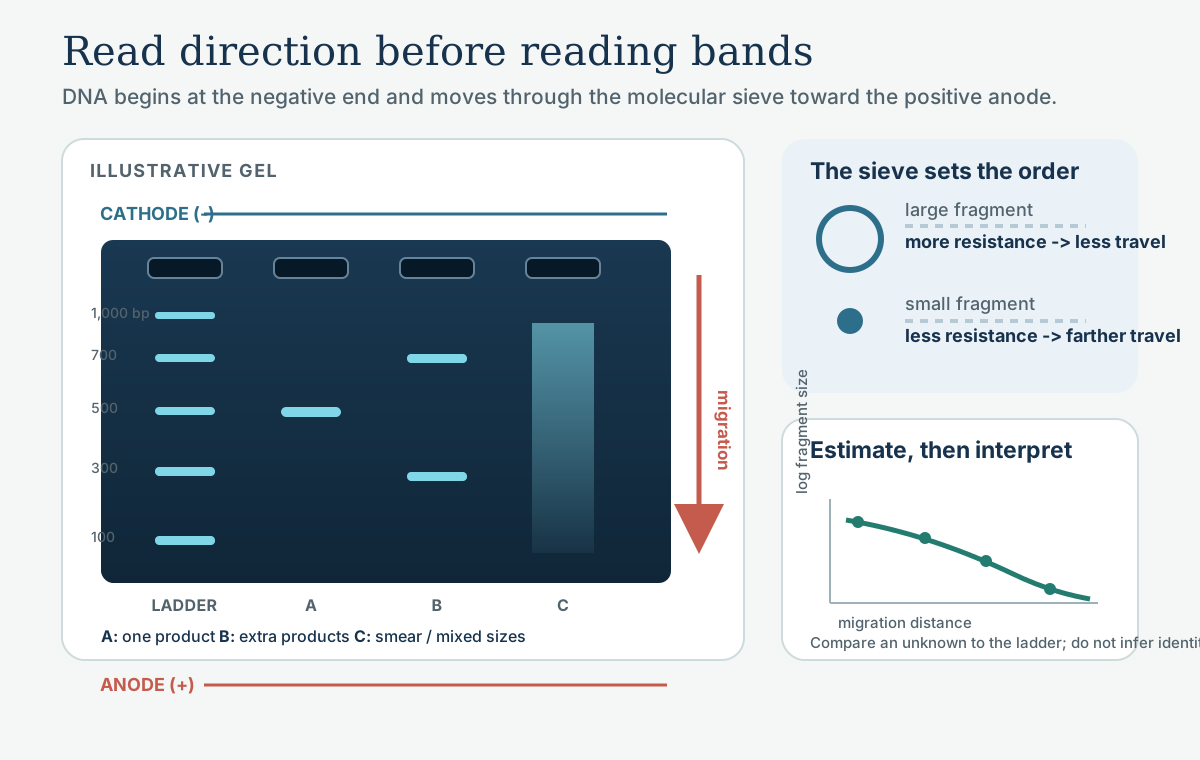
Every phosphate carries a negative charge, so DNA moves toward the positive electrode (anode), and its charge grows in step with its length 1. That makes charge-per-length roughly constant, and separation comes from the gel: a mesh that lets small fragments slip through faster than large ones 2. Load at the negative end (wells near the black cathode) - “run to red.”
Quick check
Every phosphate carries one negative charge; small fragments slip through the pores faster.
Agarose or polyacrylamide
| Agarose | Polyacrylamide | |
|---|---|---|
| Made by | melting seaweed polysaccharide in buffer | polymerizing acrylamide (a neurotoxin before it sets) |
| Pores | large | small, uniform |
| Range | about 100 bp to 25 kb | a few bp to about 1 kb |
| Resolution | a few percent of size | a single base |
| Use | PCR products, digests, integrity checks | small fragments, oligos, fine sizing 3 |
Agarose percentage tunes the range 3: about 0.7% for large fragments (several kb), 1% for 0.5-10 kb, 2% for 100-1,000 bp, and 3% for small PCR products. Higher percentage, smaller pores, better separation of small pieces.
Quick check
Polyacrylamide resolves single-base differences in small fragments; agarose can’t.
Buffers
TAE (Tris-acetate-EDTA) and TBE (Tris-borate-EDTA) carry current and hold the pH so the backbone stays charged. TAE separates large fragments a bit better; TBE buffers longer and resolves small fragments more sharply 3. EDTA chelates the Mg²⁺ nucleases need. Use the same buffer for the gel and the tank.
Loading dye adds density (glycerol) so the sample sinks into the well, plus tracking dyes to watch progress.
Sizing with a ladder
Over a gel’s working range, migration distance is roughly linear with the log of size 3. A ladder of known fragment sizes in its own lane lets you interpolate: find the two ladder bands that bracket the sample and estimate between them, remembering that on a log scale the bands crowd together toward the top 2.
Band brightness reflects mass: a ladder with stated masses per band lets you roughly estimate how much product you have.
Quick check
Interpolate against the bracketing ladder bands; migration is roughly linear with log size.
Stains
Fluorescent dyes bind between or alongside the bases and glow under UV or blue light 3:
- Ethidium bromide: classic, cheap, viewed under UV; a mutagen, so gloves and dedicated waste.
- SYBR and GelRed-type dyes: more sensitive, many viewable under blue light, marketed as safer.
- UV safety: face shields for transilluminators; UV also nicks DNA you plan to recover from the gel, so minimize exposure (blue light avoids this).
Reading a gel
| What you see | Likely cause |
|---|---|
| One sharp band at the expected size | specific product |
| Fuzzy band below about 50-100 bp, also in the NTC | primer dimer |
| Expected band in the NTC | contamination - stop and investigate |
| Extra bands at other sizes | nonspecific priming; raise annealing temperature, redesign |
| Smear from the well down | degraded template, overloaded DNA, or too many cycles |
| High band stuck in the well | intact genomic DNA (good, for an integrity check) or overload |
| Nothing, ladder fine | failed reaction or inhibition - check the positive control |
| Nothing, ladder missing too | stain or imaging problem |
| Bands curved (“smiling”) | gel overheated; run at lower voltage |
Quick check
Primers annealing to each other make a short product, often visible in the NTC; no 250 bp band there means no contamination.
Uses
- Checking PCR products before sequencing or cloning.
- Restriction digests and PCR-RFLP genotyping (see Restriction Enzymes and RFLP).
- Integrity of DNA and RNA (see Assessing Quality and Quantity).
- Gel extraction: cut out a band and purify it.
Slab gels are cheap and simple but manual and coarse. Capillary electrophoresis, next, does the same separation with single-base resolution and automated fluorescent detection.
What to take from this
DNA runs to the anode and separates by size because charge scales with length. Pour agarose (0.7-3%) for most work and polyacrylamide for single-base resolution; use TAE or TBE. Size bands by interpolating against a ladder on a log scale. Read the controls first: a dimer in the NTC is harmless, a product band in the NTC means contamination, and a blank sample lane with a good ladder means the reaction failed.
Lesson complete
Nice work.
Sources for this lesson
- 1Bruce Alberts, Rebecca Heald, Alexander Johnson, David Morgan, Martin Raff, Keith Roberts, Peter Walter. Molecular Biology of the Cell. 7th ed. W. W. Norton & Company. 2022. verifiedThe canonical cell/molecular biology textbook; used for nucleic-acid chemistry and the central dogma.
- 2Lela Buckingham. Molecular Diagnostics: Fundamentals, Methods, and Clinical Applications. 3rd ed. F.A. Davis Company. 2019. verifiedThe standard clinical molecular-diagnostics textbook for MLS/MB programs; author holds MB DLM(ASCP). Covers nucleic-acid chemistry, techniques, lab operations, and applications across infectious disease, oncology, genetics, and identity. Primary topic reference for the ASCP MB program.
- 3Michael R. Green, Joseph Sambrook. Molecular Cloning: A Laboratory Manual. 4th ed. Cold Spring Harbor Laboratory Press. 2012. verifiedThe classic three-volume molecular-biology methods manual — authoritative for nucleic-acid isolation, electrophoresis, restriction digestion, labeling, and hybridization techniques. Standard-tier topic reference for the techniques courses.