Where the Money Goes
Tracing where an object's money may go: five cost drivers, fixed versus variable cost and volume, the steps between production cost and retail price, and sorting spending into performance, consistency and service, and market and meaning.
- 7 min
- 7 steps
- 3 questions
- Lesson 2 of 49
In this lesson
- Build a STACK of cost drivers
- Fixed cost changes shape with volume
- Production cost is not retail price
- Which spending reaches the object?
- Side-by-side exercise: reconstruct without pretending
- Rule of thumb
Open alongside this lesson
-
They look identical, but one costs $5,000 more. Where the money actually goes might surprise you... (opens in a new tab)
Treat the episode as a cost-driver hypothesis. Sort each proposed difference into disclosed fact, visible observation, inference, or unknown.
-
Design for Manufacture (opens in a new tab)
Connect part count, process choice, tooling, assembly, labor, and production volume.
-
Fundamentals of cost accounting and environmental management accounting: Variable and fixed costs (opens in a new tab)
Use the relevant-range warning before assuming one unit-cost formula holds at every production scale.
-
$600 for a sweatshirt…why? How is that even possible? #cotton #fashion #hoodie (opens in a new tab)
Sort the proposed fiber, yarn, knitting, finishing, construction, scale, channel, and brand differences into evidenced cost, visible feature, inference, and symbolic value.
Picking up where you left off.
Two objects can share a silhouette and still arrive through very different systems. One may use a costly process, carry years of development, reject many imperfect parts, include repair service, or pass meaningful tests. Another may exploit efficient tooling and enormous volume. A third may be physically ordinary but expensive to advertise and distribute. All three can have legitimate costs. Only some costs improve the object’s performance for you.
Fineas Jackson’s “$5,000 more” comparison asks the right opening question: where might the money go 1? The disciplined next step is to resist turning an engaging cost story into a verdict. A costly method is not automatically a useful method, and a plausible explanation is not audited financial data.
Playback is optional. If the player is unavailable, open the video at its source.
Build a STACK of cost drivers
Use STACK to remember five places resources may be committed before and after an object reaches you.
- S — Stuff and scrap: raw materials, purchased components, energy, consumables, packaging, rejected parts, cutting loss, and freight into the factory.
- T — Time and tooling: direct labor, setup, jigs, molds, dies, machines, maintenance, and the time spent assembling or finishing.
- A — Assurance and aftercare: prototypes, engineering, inspection, safety or performance testing, documentation, warranty reserves, repair staff, and spare parts.
- C — Channel and carrying: warehouses, inventory financing, distribution, retailer occupancy, payment fees, theft, returns, markdowns, customer support, and outbound shipping.
- K — Knowledge and identity: research, design, patents, creative work, brand building, photography, advertising, collaborations, and the story that makes an object recognizable.
The categories overlap. A designer’s salary could be development cost or an intangible investment; return handling could sit in channel operations or aftercare. The point is not perfect accounting. It is to prevent “material plus labor” from masquerading as the whole system.
MIT’s design-for-manufacture teaching connects cost with process, part count, tooling, labor, and assembly choices 2. A one-piece molded shell, for example, may require expensive engineering and a mold but little assembly per unit. A comparable-looking shell made from several joined pieces may need cheaper tooling but more labor. Appearance does not disclose the equation.
Fixed cost changes shape with volume
Split the simplified production ledger into:
Total production cost = fixed cost + variable cost × quantity
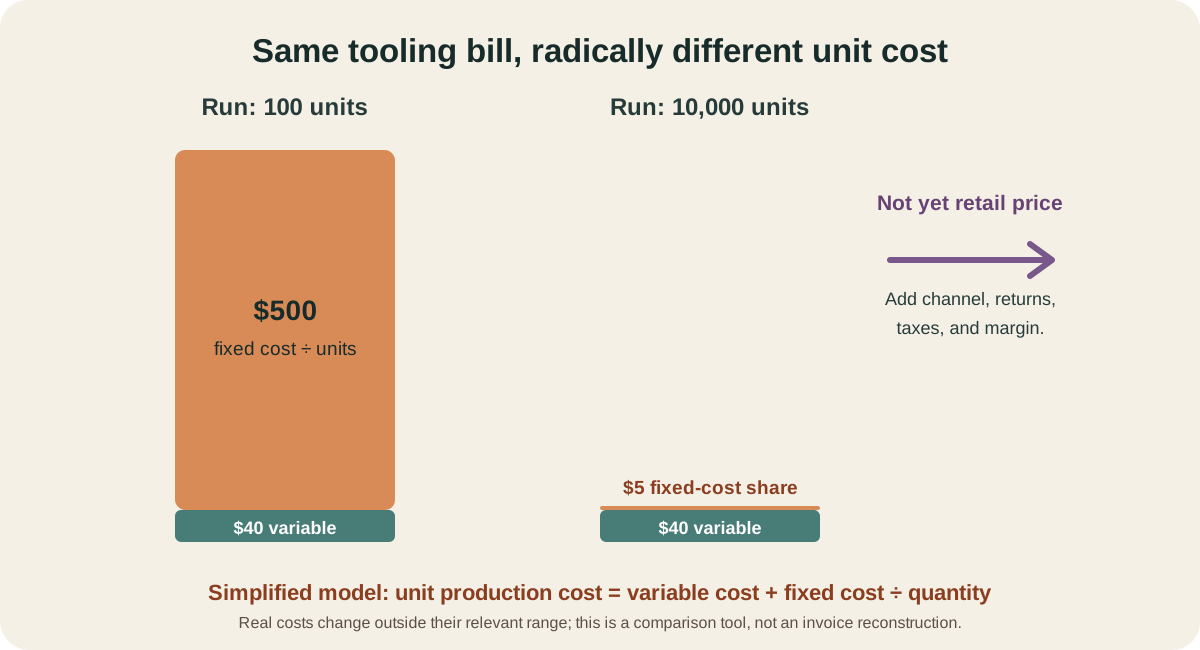
Unit production cost = variable cost per unit + fixed cost ÷ quantity
Fixed costs do not change directly with each additional unit within a relevant range: initial tooling, a design fee, or one certification program. Variable costs rise with output: material per unit, piece-rate labor, and packaging. The Open University emphasizes both the distinction and its limit: outside a relevant range, rent, staffing, discounts, capacity, and even the “fixed” or “constant” assumptions can change 3.
Suppose development and tooling total $50,000 and variable cost is $40:
- at 100 units:
$40 + $50,000 ÷ 100 = $540simplified production cost per unit; - at 10,000 units:
$40 + $50,000 ÷ 10,000 = $45per unit.
The small-run object is not necessarily “five hundred dollars better.” Its buyers carry much more of the setup. The large-run object is not necessarily compromised; efficient volume may fund excellent process control. The Open University’s manufacturing lesson similarly shows why tooling and quantity can change which process is economical 4.
Production cost is not retail price
After production, an object may acquire inbound freight, duty, warehousing, wholesale and retail operations, returns, taxes, and margin. Margin is not automatically take-home profit. It is the portion available to cover selling and operating costs and, if anything remains, profit. A direct-to-consumer seller, department store, marketplace, and local specialist carry different structures.
Do not use a universal markup multiplier. Instead, draw a boundary ladder:
- direct material and component cost;
- factory conversion cost;
- unit production cost including allocated development and overhead;
- landed cost after freight and duty;
- wholesale or transfer price;
- retail transaction price;
- owner’s lifecycle cost.
When someone says “It costs only $15 to make,” ask which rung the number describes, which items it excludes, the source of the number, the production quantity, and the year. A narrow factory estimate can be accurate and still fail to explain the retail system.
Which spending reaches the object?
Separate spending into three effects:
Performance spending
Better-toleranced components, an appropriate material grade, robust joints, ergonomic development, or relevant testing can improve fitness for use. The connection must be demonstrated: name the characteristic and requirement affected.
Consistency and service spending
Inspection, process control, a repair network, useful documentation, and stocked parts may not change the showroom sample. They can reduce variation, extend service, or make failure less costly. Ask for test protocols, parts availability, warranty exclusions, and realistic turnaround.
Market and meaning spending
Distribution, photography, packaging, brand history, and controlled availability can make an object accessible, legible, desirable, or socially meaningful. WIPO’s reporting treats brands and other intangibles as real economic assets 5. “Real cost” does not mean “physical performance.” A buyer may willingly fund identity or cultural association; the error is smuggling that preference into an engineering claim.
Even performance spending can miss. Extra handwork may introduce charming variation or unacceptable inconsistency. A rare material may be beautiful but brittle in the intended climate. Expensive packaging may protect shipping or merely decorate disposal. Ask what changed for the user.
Side-by-side exercise: reconstruct without pretending
Choose two similar objects with a meaningful price gap. Make one row for every STACK category and three evidence columns:
| Possible driver | Evidence | Status |
|---|---|---|
| Material grade | supplier specification or label | disclosed / inferred / unknown |
| Assembly time | construction visible at seams or fasteners | observed / unknown |
| Testing | named method and result | documented / marketing-only |
| Repair | parts page, manual, service quote | available / conditional / absent |
| Channel | seller and return terms | documented / inferred |
| Story | campaign, provenance, collaboration | documented; effect on performance separate |
Then perform two passes.
Pass one: explain price. Write the most plausible cost and market reasons for the gap. Use ranges. Mark missing data.
Pass two: justify choice. Ignore sunk producer effort and ask which differences improve your required outcomes. Estimate lifecycle cost per successful use. You may conclude that the high price is understandable but not valuable to you—or that a service system makes the higher price rational even though the visible objects look alike.
Rule of thumb
A cost story explains resources, not results. Trace where the money may go, identify which spending reaches performance or service, and keep brand meaning honest. The strongest conclusion often has two clauses: “I can see why it costs more, and…” The second clause—“it works better for my job,” “I value the craft,” or “I still would not buy it”—is the decision that matters.
Practice
Fixed cost per unit is $50,000 ÷ 10,000 = $5. Add the $40 variable cost for a simplified $45 unit production cost.
Practice
The gap between landed or wholesale cost and retail price can support many channel activities. Actual structures vary and should not be invented without evidence.
Practice
Testing and inspection can support conformance and performance when methods and requirements are relevant. Other spending may affect price or desirability without improving product quality.
Lesson complete
Nice work.
Sources for this lesson
- 1Fineas Jackson. They look identical, but one costs $5,000 more. Where the money actually goes might surprise you.... Fineas Jackson on YouTube. 2026. verifiedChasing Beauty episode 34; 2:49. Used as a case or observation prompt, not as the sole authority for technical claims. Cited at: episode 34.
- 2Design for Manufacture. MIT OpenCourseWare. 2010. verifiedTeaching material on direct and indirect manufacturing costs, part count, process choice, tooling, labor, and assembly. Cited at: lecture themes.
- 3Fundamentals of cost accounting and environmental management accounting: Variable and fixed costs. The Open University. verifiedOpen lesson explaining fixed costs, variable costs, contribution, and the limited range over which simple unit-cost assumptions hold. Cited at: fixed and variable costs.
- 4Production costs. The Open University. verifiedOpen lesson explaining fixed and variable costs, tooling, volume, and why the economical process changes with production quantity. Cited at: production quantity and process choice.
- 5World Intangible Investment Highlights 2026. World Intellectual Property Organization. 2026. verifiedEvidence that brands and other intangible assets carry economic value beyond a product's measurable physical attributes. Cited at: intangible-asset scope.