Working with Arrays and Plotting (NumPy and Matplotlib)
Why engineers use NumPy arrays instead of loops: vectorized arithmetic, slicing, and broadcasting, then turning arrays into labeled Matplotlib plots of models and measurements.
- 3 min
- 3 steps
- 3 questions
- Lesson 26 of 78
In this lesson
- Why arrays, not loops
- Broadcasting and slicing
- Plotting with Matplotlib
Picking up where you left off.
Why arrays, not loops
Engineering computation is mostly arithmetic on lots of numbers — a temperature
at every node of a mesh, a voltage at every time step. Plain Python lists can hold
those numbers, but operating on them element by element with explicit loops is both
slow and verbose. NumPy introduces the ndarray, a fixed-type, n-dimensional
array, and lets you express whole-array operations at once 1.
import numpy as np

x = np.linspace(0, 2 * np.pi, 100)   # 100 evenly spaced points
y = np.sin(x)                        # applies sin to every element at once
energy = 0.5 * y**2                  # arithmetic is element-wise
peak = y.max()
There is no loop. np.sin(x) operates on the entire array, and y**2 squares
every element — this is vectorization. It is shorter to read and dramatically
faster, because the looping happens in compiled code rather than the Python
interpreter 1.
Quick check
This is vectorization.
Broadcasting and slicing
Two array ideas do most of the heavy lifting. Slicing selects subarrays —
x[0], x[-1], x[10:20], or A[:, 0] for the first column of a 2-D array.
Broadcasting lets arrays of different shapes combine: adding a scalar to an
array adds it to every element, and a row vector can combine with a column vector
to fill a grid 1. Together they replace most of the loops a
newcomer is tempted to write.
Quick check
The colon means all rows; 0 picks the first column.
Quick check
A row and a column vector can broadcast into a full grid.
Plotting with Matplotlib
Numbers become insight through plots. Matplotlib is the standard plotting
library; its pyplot interface mirrors the steps you would take by hand — draw the
data, then label it.
import matplotlib.pyplot as plt

plt.plot(x, y, label="model  y = sin(x)")   # a line
plt.scatter(sx, sy, label="measurements")    # points
plt.xlabel("x"); plt.ylabel("y")
plt.legend()
plt.savefig("figure.png")   # or plt.show()
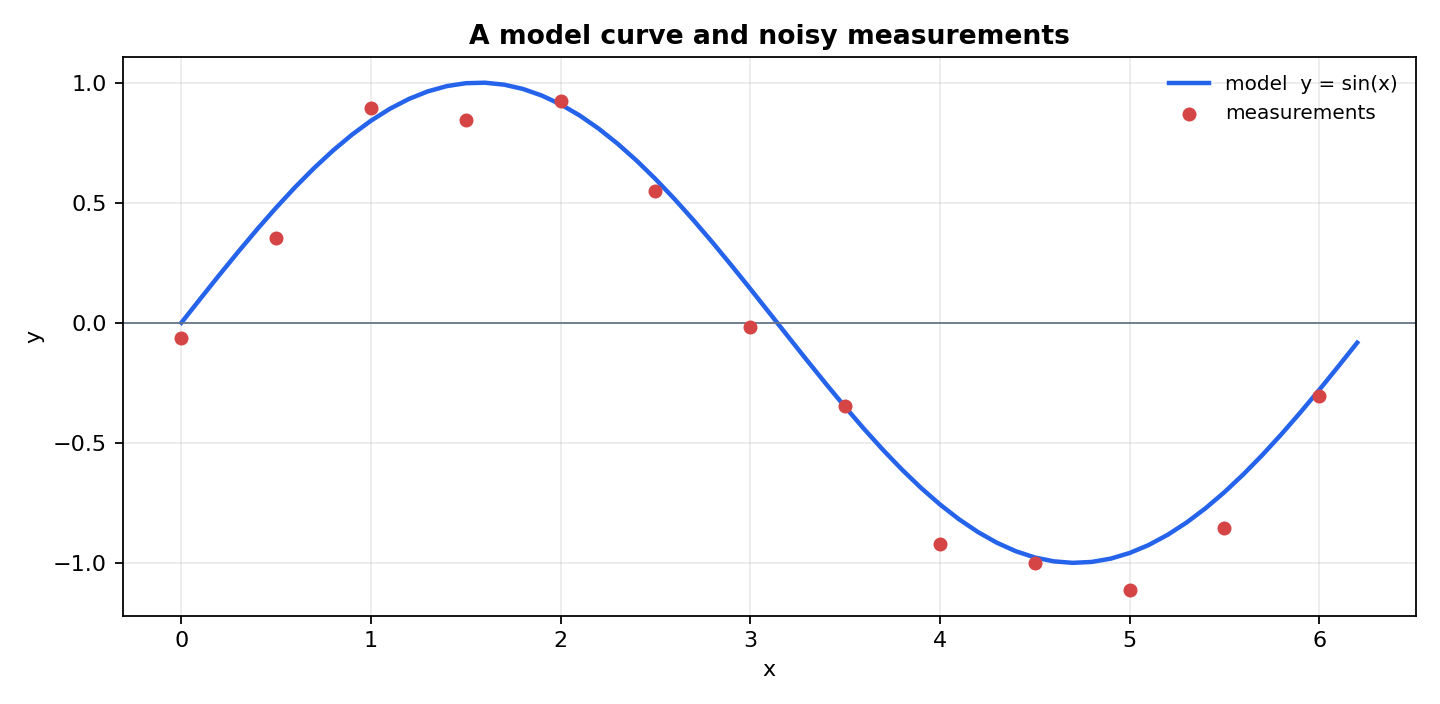
The figure below was produced by essentially this code — a continuous model curve plus scattered measurements, with axis labels and a legend.
Every figure in this program is generated exactly this way: a short script computes
arrays and renders a raster image. Mastering ndarray operations and a handful of
plotting calls covers the large majority of day-to-day engineering computation, and
sets up the numerical methods in the next module, which are all expressed as
operations on arrays.
Lesson complete
Nice work.
Sources for this lesson
- 1