Measuring Real Programs
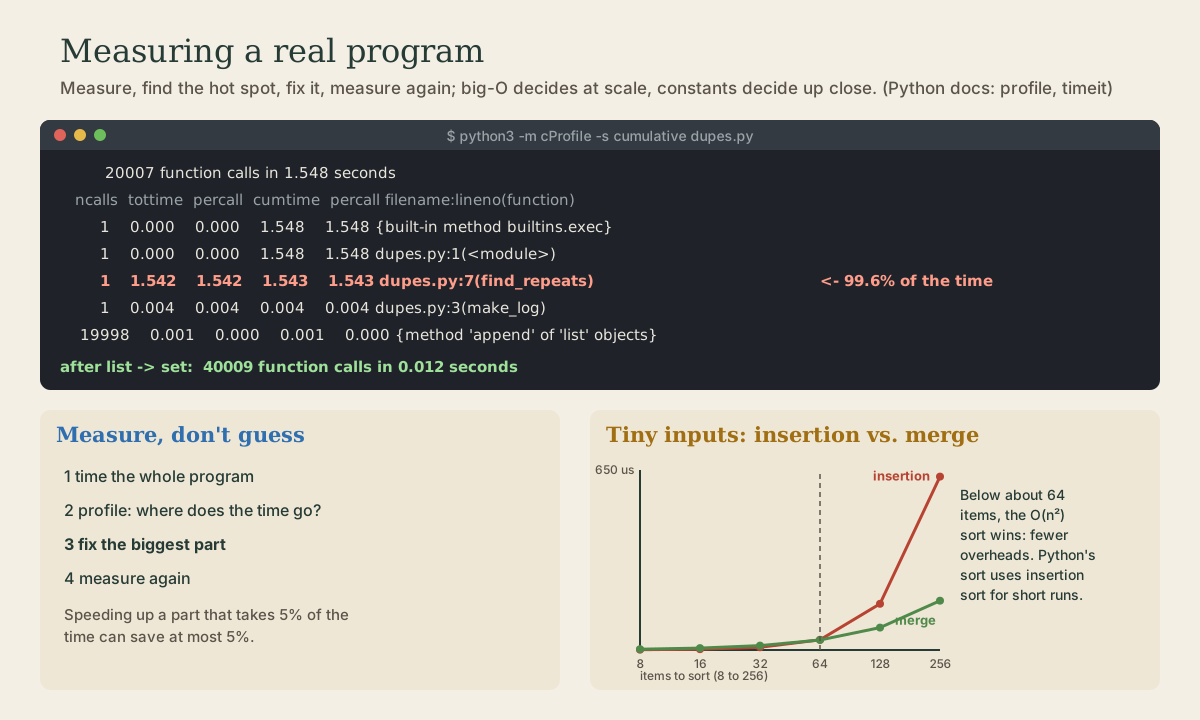
Big-O predicts how time grows; only measuring tells you where a real program spends it. Timing whole programs with bash's time and GNU time; timing small pieces of Python with timeit and reading its output; profiling with cProfile, where one function turned out to take 99.6% of a program's 1.5 seconds and changing two lists to sets cut it to 0.012 seconds; and where big-O isn't the whole story, from insertion sort beating merge sort below about 64 items, which is why Python's sort uses it for short runs, to the memory hierarchy.
- 10 min
- 7 steps
- 3 questions
- Lesson 80 of 80
In this lesson
- Measure, don’t guess
- Timing a whole program
- Timing small pieces
- Profiling
- When big-O isn’t the whole story
- Your turn
- So
Picking up where you left off.
Measure, don’t guess
Big-O tells you how an algorithm’s time grows. It doesn’t tell you how long a real program takes, or which part of it is slow: the constants it hides depend on the language, the machine, and the memory hierarchy, and a timing result holds only for the machine it was measured on 1. Guessing which part of a program is slow is unreliable, so the method is:
- Time the whole program, so you know where you’re starting.
- Profile it to find where the time actually goes.
- Fix the biggest part.
- Measure again, to confirm the fix helped and nothing else broke.
Step 2 is what saves effort. If a function takes 5% of the running time, even making it infinitely fast saves only 5%.
Quick check
That’s why you profile first: the big wins are in the parts that take most of the time.
Timing a whole program
Bash’s time (module 4) reports wall time, real, and CPU time, user and sys 2. For memory, there’s also the separate GNU time program; since bash’s built-in time comes first, run it by its path, /usr/bin/time. With -v it reports, among much else, the program’s maximum resident set size: the most physical memory it used at once, in kilobytes 3.
time python3 dupes.py
/usr/bin/time -v python3 dupes.py
Timing small pieces
To compare two ways of writing a few lines, use Python’s timeit. It runs the code many times, repeats the whole measurement five times, and reports the best, which avoids several common mistakes, such as timing a single run or counting setup work 4. -s gives setup code that runs once and isn’t timed 4. On a desktop PC:
me@linuxbox:~$ python3 -m timeit -s "data = list(range(1000))" "total = 0" "for x in data: total += x"
20000 loops, best of 5: 12.9 usec per loop
me@linuxbox:~$ python3 -m timeit -s "data = list(range(1000))" "sum(data)"
100000 loops, best of 5: 3.37 usec per loop
me@linuxbox:~$ python3 -m timeit -s "data = list(range(1000))" "[x * 2 for x in data]"
20000 loops, best of 5: 14.9 usec per loop
me@linuxbox:~$ python3 -m timeit -s "data = list(range(1000))" "out = []" "for x in data: out.append(x * 2)"
20000 loops, best of 5: 17.4 usec per loop
Each extra argument is another line of the statement being timed. Read the output as: the statement ran 20,000 times per measurement, the measurement was repeated 5 times, and the best average was 12.9 microseconds per run 4. The built-in sum is almost four times faster than a loop doing the same O(n) work, and a list comprehension beats a loop calling append. Same big-O, different constants: built-ins run in C.
Profiling
A profiler records how many times each function was called and how long it took 5. Python’s is cProfile, which you can run on any script without changing it 5. Here’s a program that finds which visitor IDs appear more than once in a fake log of 40,000 lines. Save it as dupes.py:
# dupes.py: which visitor IDs appear more than once in a day's log?

def make_log(n):
    """Fake log lines; squares wrap around, so some IDs repeat."""
    return [f"visitor-{(i * i) % 19997}" for i in range(n)]

def find_repeats(lines):
    seen, repeats = [], []
    for line in lines:
        if line in seen:                # seen is a list: this checks every item so far
            if line not in repeats:
                repeats.append(line)
        else:
            seen.append(line)
    return repeats

def summarize(repeats):
    return sorted(repeats)[:3]

lines = make_log(40_000)
repeats = find_repeats(lines)
print(len(repeats), "repeated visitors, first few:", summarize(repeats))
Run it under the profiler, sorted by cumulative time:
me@linuxbox:~$ python3 -m cProfile -s cumulative dupes.py
9999 repeated visitors, first few: ['visitor-0', 'visitor-1', 'visitor-10']
         20007 function calls in 1.548 seconds

   Ordered by: cumulative time

   ncalls  tottime  percall  cumtime  percall filename:lineno(function)
        1    0.000    0.000    1.548    1.548 {built-in method builtins.exec}
        1    0.000    0.000    1.548    1.548 dupes.py:1(<module>)
        1    1.542    1.542    1.543    1.543 dupes.py:7(find_repeats)
        1    0.004    0.004    0.004    0.004 dupes.py:3(make_log)
    19998    0.001    0.000    0.001    0.000 {method 'append' of 'list' objects}
        1    0.000    0.000    0.001    0.001 dupes.py:17(summarize)
        1    0.001    0.001    0.001    0.001 {built-in method builtins.sorted}
        1    0.000    0.000    0.000    0.000 {method 'disable' of '_lsprof.Profiler' objects}
        1    0.000    0.000    0.000    0.000 {built-in method builtins.print}
        1    0.000    0.000    0.000    0.000 {built-in method builtins.len}
The columns 5:
- ncalls: how many times the function was called.
- tottime: time spent in the function’s own code, not counting functions it called.
- cumtime: time in the function and everything it called.
- percall: the time divided by the number of calls.
The top lines, exec and <module>, are just the whole script. The story is in find_repeats: 1.542 seconds of its own time out of 1.548, 99.6% of the program. Making the log or sorting the results doesn’t matter at all.
Why is it slow? line in seen on a list is O(n), done once per line, so the whole loop is O(n²): last module’s list-versus-set problem, hiding in a real program. The fix is to make both seen and repeats sets:
def find_repeats(lines):
    seen, repeats = set(), set()
    for line in lines:
        if line in seen:                # seen is a set: one hash lookup
            repeats.add(line)
        else:
            seen.add(line)
    return repeats
Then measure again:
me@linuxbox:~$ python3 -m cProfile -s cumulative dupes.py
9999 repeated visitors, first few: ['visitor-0', 'visitor-1', 'visitor-10']
         40009 function calls in 0.012 seconds

   Ordered by: cumulative time

   ncalls  tottime  percall  cumtime  percall filename:lineno(function)
        1    0.000    0.000    0.012    0.012 {built-in method builtins.exec}
        1    0.000    0.000    0.012    0.012 dupes.py:1(<module>)
        1    0.004    0.004    0.007    0.007 dupes.py:7(find_repeats)
        1    0.004    0.004    0.004    0.004 dupes.py:3(make_log)
Same answer, 1.548 seconds down to 0.012: over a hundred times faster, from changing the data structure, and with ten times more lines the gap would be over a thousand times. Note that a profiler slows down the code it watches; use it to find where time goes, and timeit or time for the real numbers 5.
Quick check
tottime and cumtime?A function with a big tottime is where the work is actually happening; a big cumtime may just mean it calls something slow.
When big-O isn’t the whole story
Big-O describes large n. For small inputs, the constant costs it ignores, such as function calls, building new lists, and Python’s own overhead, can decide the race. This program times last lesson’s two sorts on tiny lists. Save it as small.py, next to sorts.py:
# small.py: on tiny inputs, does O(n^2) insertion sort lose to O(n log n) merge sort?
import random
import timeit

from sorts import insertion_sort, merge_sort

random.seed(5)
print(f"{'n':>5}  {'insertion':>10}  {'merge':>10}   (microseconds per sort)")
for n in (8, 16, 32, 64, 128, 256):
    data = [random.random() for _ in range(n)]
    ins = min(timeit.repeat(lambda: insertion_sort(data), number=200, repeat=5)) / 200 * 1e6
    mrg = min(timeit.repeat(lambda: merge_sort(data), number=200, repeat=5)) / 200 * 1e6
    print(f"{n:>5}  {ins:>10.1f}  {mrg:>10.1f}")
me@linuxbox:~$ python3 small.py
    n   insertion       merge   (microseconds per sort)
    8         1.0         2.9
   16         3.0         6.9
   32         9.6        16.0
   64        37.0        36.0
  128       166.7        81.0
  256       626.1       177.9
Below about 64 items, the “worse” O(n²) sort wins: merge sort pays for its recursive calls and new lists on every split. Above that, n² takes over, and by 256 items insertion sort is three and a half times slower. Real sorts use both: Python’s sort extends short runs to a minimum length with insertion sort before merging them, and its authors found minimum lengths of 16 to 128 worked about equally well on random data 6.
Other constants that big-O ignores, from earlier modules:
- The memory hierarchy: summing the same ten million numbers took almost six times longer in a random order than in order (module 3). Same O(n), different use of the cache.
- The language: Python’s
sorted()beat our merge sort by about twenty times, because it’s the same kind of algorithm written in C. - System calls: a million one-byte writes took thirty times longer than buffered ones (module 4).
Big-O decides what happens at scale; measurement decides everything else.
Quick check
Python’s own sort takes advantage of exactly this, using insertion sort to build its short runs.
Your turn
Exercises
- Time the two examples from the
timeitdocumentation:"'-'.join(str(n) for n in range(100))"and"'-'.join(map(str, range(100)))". Which is faster on your machine? - Profile
sorts.pywithpython3 -m cProfile -s tottime sorts.py. Which function has the mosttottime? What does13997/3in thencallscolumn formerge_sortmean? - In
dupes.py, make onlyseena set and leaverepeatsa list. Profile it. How much of the improvement do you get, and why? - Run
/usr/bin/time -v python3 dupes.pyand find the maximum resident set size. Then try it withmake_log(4_000_000)and the fast version. - Run
small.pyon your machine. Where is the crossover?
Answers
- On a desktop PC, the generator version took 4.83 microseconds per loop and the
mapversion 4.52: close, withmapslightly ahead. Your numbers will differ; that’s why you measure. insertion_sort, with 0.263 of 0.304 seconds in one run.13997/3means 13,997 calls in all, of which 3 were primitive, not made bymerge_sortcalling itself: the recursion made the other 13,994 5.- Very little: one run took 0.667 seconds against 1.548.
line not in repeatsis still a list scan, andrepeatsgrows to almost 10,000 items, so the loop is still O(n²). Both lists had to become sets. - The figure is in kilobytes; it grows with the log, since the whole list of lines is in memory at once.
- Usually somewhere between 32 and 128 items, depending on the machine and the Python version.
So
Measure, don’t guess: time the whole program, profile to find where the time goes, fix the biggest part, and measure again. time and /usr/bin/time -v measure whole programs, including memory; timeit compares small pieces of code; cProfile shows each function’s calls, own time (tottime), and total time (cumtime). In the example, one O(n²) list scan took 99.6% of the time, and sets made the program over a hundred times faster. Big-O wins at scale, but constants, from function calls to caches to C versus Python, decide small inputs, which is why real sorts combine insertion sort and merge sort.
Lesson complete
Nice work.
Sources for this lesson
- 1Pat Morin. Open Data Structures (in pseudocode), Edition 0.1G beta. opendatastructures.org (paperback by AU Press). verifiedFree textbook under a Creative Commons Attribution license. Used: ch. 1, the need for efficiency (a million searches of a million items is 10^12 inspections, over 16 minutes at a billion operations a second), interfaces versus implementations, the Queue (FIFO), Stack (LIFO), and Deque; ch. 2, array-based lists (constant-time get and set, add and remove at i costing O(n - i) for the shifting, growing by allocating an array of twice the size and copying, amortized O(1) growth); ch. 3, singly and doubly linked lists (nodes with references; get(i) walks from the head; insert or delete next to a known node in constant time); ch. 5, hash tables with chaining (an array of lists, hash(x) choosing the list, n kept at most the table length so lists average one item, doubling and reinserting when full) and hash codes (equal objects must have equal hash codes, unequal ones should rarely collide); ch. 6, binary trees (root, parent, child, leaf, depth, height) and the binary search tree property, O(n) worst case when unbalanced; ch. 7, random binary search trees, with search paths of length at most about 2 ln n; ch. 12, graphs (vertices, directed edges, paths, cycles; adjacency matrix with O(n^2) space versus adjacency lists with O(n + m); breadth-first search with a queue and a seen array, O(n + m), visiting vertices in order of distance and giving shortest paths; depth-first search, breadth-first search with a stack instead of a queue, used to detect cycles); ch. 14, B-trees, whose nodes have between B and 2B children and fit in one external-memory block, the primary data structure in file systems including ext4, NTFS, and HFS+, every major database, and cloud key-value stores.
- 2Chet Ramey, Brian Fox. Bash Reference Manual, Edition 5.3. GNU Project, Free Software Foundation. 2025. verifiedThe reference for Bash 5.3 (May 18, 2025). Redirections (3.6) are processed left to right and order matters: ls > dirlist 2>&1 sends both streams to dirlist, while ls 2>&1 > dirlist sends only standard output there. With set -o noclobber, > fails on an existing regular file and >| overrides it. &> word is equivalent to > word 2>&1 and &>> word to >> word 2>&1. Here documents (<<word, with <<- stripping leading tabs; quoting word disables expansion) and here strings (<<<). Expansions (3.5) happen in a fixed order: brace; tilde, parameter, arithmetic, and command substitution left to right; word splitting; filename expansion; quote removal last. Startup files (6.2): an interactive login shell reads /etc/profile then the first of ~/.bash_profile, ~/.bash_login, ~/.profile; an interactive non-login shell reads ~/.bashrc. HISTCONTROL (ignorespace, ignoredups, ignoreboth), HISTSIZE, HISTFILESIZE; set -x traces expanded commands; shell functions and variables, export.
- 3time(1) manual page. man7.org (Linux man-pages). verifiedGNU time runs a program and reports its resource use; -v gives verbose output, including the maximum resident set size during its lifetime, in kilobytes (%M). Some shells, such as bash, have a built-in time with similar information; to reach the real command, give its path, /usr/bin/time.
- 4timeit: Measure execution time of small code snippets (Python documentation). Python Software Foundation. verifiedTimes small bits of Python code from the command line (python -m timeit, with -s for setup statements) or from Python, avoiding common traps in measuring execution times. Output such as '10000 loops, best of 5: 30.2 usec per loop' gives the loop count per repetition, the number of repetitions, and the best average time per loop.
- 5The Python Profilers (Python documentation). Python Software Foundation. verifiedcProfile and profile give deterministic profiles: how often and for how long each part of a program ran; cProfile, a C extension, is recommended. Run as python -m cProfile [-o file] [-s sort_order] script.py. Columns: ncalls (two numbers such as 3/1 when the function recursed), tottime (time in the function itself, excluding sub-functions), cumtime (time in it and everything it called), percall. The profilers are for finding where time goes, not for benchmarking; use timeit for that.
- 6Tim Peters. listsort.txt: notes on CPython's list sort. CPython source repository (GitHub). verifiedDescribes CPython's sort as an adaptive, stable, natural mergesort (timsort): it scans left to right identifying runs already in order (reversing descending ones), boosts short runs to minrun elements with binary insertion sort, and merges runs, now with the powersort merge strategy; on partially ordered data it needs fewer than lg(N!) comparisons, and as few as N-1.