What a Process Is
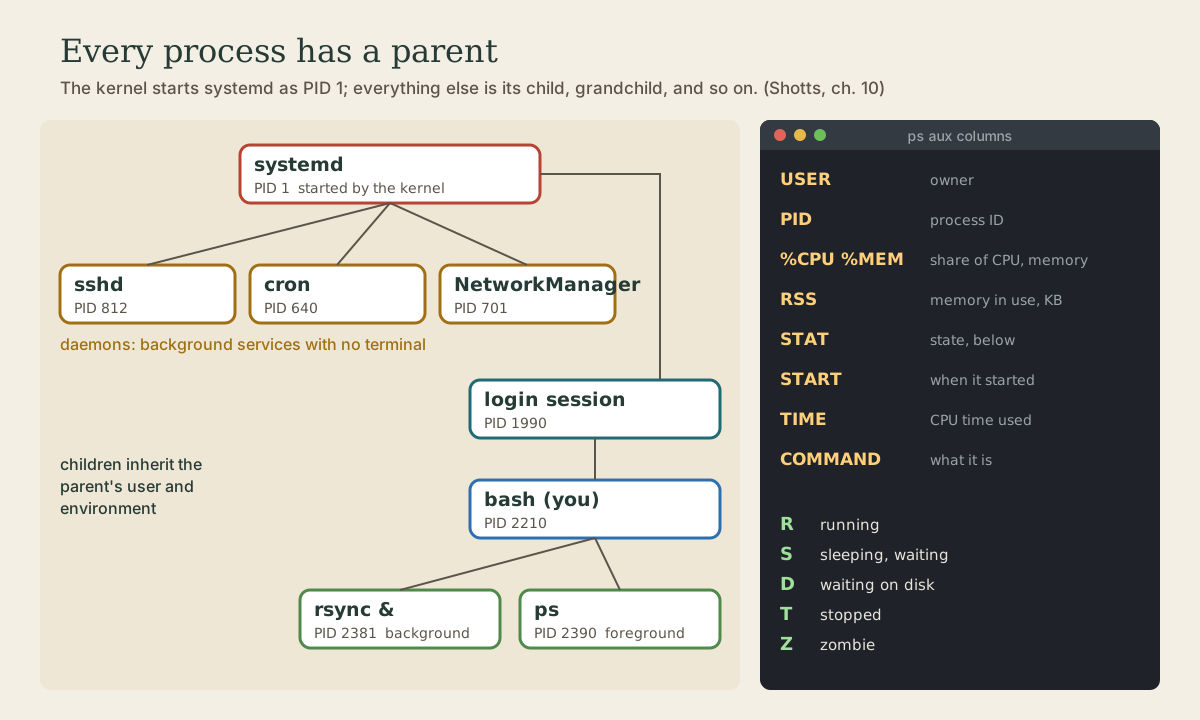
A process is a running program. The kernel starts systemd as process 1, which starts the background services (daemons), and every program you run is a child of your shell. See them with ps (ps, ps x, ps aux and its columns and states), watch them live with top or htop, draw the family tree with pstree, and read load average, memory, and CPU numbers without fooling yourself.
- 6 min
- 6 steps
- 3 questions
- Lesson 16 of 80
In this lesson
- Programs that are running
- ps
- top
- pstree and friends
- Your turn
- So
Picking up where you left off.
Programs that are running
A process is a program that’s running. Linux runs many at once by switching between them very quickly, so it seems they all run together 1.
At boot, the kernel starts a program called init, which on nearly every distribution today is systemd. It’s always process ID 1, and it starts all the system’s services 1. Many of those services are daemons: programs that sit in the background with no window or terminal, like the SSH server, the scheduler cron, and the network manager. So even with nobody logged in, the system is quietly busy 1.
Any process can start others. The starter is the parent, the new one its child: your login session starts bash, and bash starts every command you type 1. A child inherits its parent’s user and environment, which is why export works the way it does.
The kernel keeps track of each process: a process ID (PID), its owner, the memory it uses, and whether it’s ready to run 1. Processes have owners just like files do.
Quick check
The kernel starts init, which on most distributions today is systemd, and gives it PID 1.
ps
ps takes a snapshot of processes 1:
me@linuxbox:~$ ps
    PID TTY          TIME CMD
   2210 pts/0    00:00:00 bash
   2390 pts/0    00:00:00 ps
Plain ps shows only this terminal’s processes. Two option sets cover most needs 1:
me@linuxbox:~$ ps x          # all your processes, terminal or not
me@linuxbox:~$ ps aux        # everyone's processes, with details
(They’re written without a dash, in the older BSD style; ps -ef is the equivalent you’ll see in other guides.)
The ps aux columns 1:
| Column | Means |
|---|---|
USER |
who owns it |
PID |
process ID |
%CPU, %MEM |
share of processor and memory |
RSS |
physical memory in use, in kilobytes |
TTY |
its terminal; ? means none (a daemon) |
STAT |
state |
START, TIME |
when it started; CPU time used so far |
COMMAND |
the command line |
The state letters 1:
| State | Means |
|---|---|
R |
running, or ready to run |
S |
sleeping: waiting for something, like input or a timer |
D |
waiting on the disk, can’t be interrupted |
T |
stopped (paused) |
Z |
zombie: finished, but its parent hasn’t collected it yet |
Extra letters after it mean higher (<) or lower (N) priority, among other things. Mostly you’ll see S: most processes spend their lives waiting.
ps aux is long, so pipe it: ps aux | less, ps aux | grep firefox, or sort by memory with ps aux --sort=-rss | head.
Quick check
ps aux, most processes show state S. Is the system stuck?R is running or ready to run. A healthy system is mostly sleeping processes waiting for work.
top
top shows processes live, refreshing every few seconds, busiest first 1:
me@linuxbox:~$ top
top - 09:52:01 up 3 days,  2:11,  1 user,  load average: 0.42, 0.37, 0.30
Tasks: 213 total,   1 running, 212 sleeping,   0 stopped,   0 zombie
%Cpu(s):  3.1 us,  1.0 sy,  0.0 ni, 95.6 id,  0.2 wa, ...
MiB Mem :  15899.6 total,   6412.3 free,   4214.0 used,   5273.3 buff/cache
The header 1:
- Load average: how many processes were running or waiting to run, averaged over the last 1, 5, and 15 minutes. Compare it with your number of CPU cores (
nproc): below that, the machine is keeping up; well above it, work is queueing. - %Cpu:
usis your programs,sythe kernel,ididle,wawaiting on the disk. - Mem:
buff/cacheis memory Linux borrows to cache files; it gives it back the moment a program needs it, so “free” looking small isn’t a problem.availableis the number to watch.
Keys inside top: M sorts by memory, P by CPU, k kills a process by PID, 1 shows each core, h for help, q to quit.
htop (sudo apt install htop) is a friendlier version with colors, scrolling, and mouse support. It’s what most people use day to day.
Quick check
Compare load with the number of cores (nproc). Load well above that means work is waiting.
pstree and friends
pstree draws the parent-child tree 1:
me@linuxbox:~$ pstree -p | less
systemd(1)─┬─cron(640)
           ├─sshd(812)
           ...
Other quick checks: uptime for load, free -h for memory, vmstat 5 for a running summary every five seconds (Ctrl-C to stop) 1, and pgrep firefox to get a program’s PIDs by name.
Your turn
Exercises
- Run
psandps x. Why is the second list so much longer? - Find PID 1 with
ps -p 1. What’s its name? - Show the five processes using the most memory.
- Open
top. What’s your load average, and how does it compare withnproc? PressM, thenq. - Start
sleep 300in one terminal tab. In another, find its PID withpgrep sleepand see its parent withps -o ppid= -p <PID>. What is the parent?
Answers
psshows only this terminal’s processes;ps xshows all of yours, including ones with no terminal (?).systemd(some systems showinit, a link to systemd). Under WSL you may seeinitinstead: WSL’s own small startup program, used when systemd isn’t enabled for the distribution.ps aux --sort=-rss | head -6(one header line plus five).- On an idle machine, well below the number of cores.
- The PID of the
bashrunning in the first tab:ps -p <that PID>showsbash.
So
Every running program is a process with an ID, an owner, and a parent, all descending from systemd, PID 1. ps aux takes a snapshot, top or htop watches live, and pstree shows the family tree. Read load average against your core count, and watch available memory, not free.
Lesson complete
Nice work.
Sources for this lesson
- 1William Shotts. The Linux Command Line, Seventh Internet Edition (25.12A). LinuxCommand.org (print edition by No Starch Press). 2026. verifiedFree CC BY-NC-ND 3.0 book, release 25.12A of July 18, 2026. Part 1, Learning the Shell: the shell and terminal emulators, prompts ($ vs. # for the superuser), command history (most distributions keep the last 1,000 commands), Shift-Ctrl-C/V for copy and paste; navigation and the directory tree; exploring the system (ls options and the long listing, file, less, the guided tour of /, symbolic links); manipulating files (wildcards and character classes, mkdir, cp, mv, rm, ln; no undelete, test wildcards with ls first); working with commands (four kinds of commands, type, which, help, --help, man and its sections, apropos, whatis, info, alias); redirection; expansion and quoting; Readline keyboard tricks, completion, history search; permissions; processes. Later parts cover the environment, vi, packages, storage, networking, find, archiving, regular expressions, text processing, and shell scripting.