Shrinkage in Three Directions
Wood shrinks most around the growth rings, about half as much across them, and almost not at all along the grain; the numbers for Wisconsin species and how to estimate shrinkage at any moisture content.
- 5 min
- 6 steps
- 3 questions
- Lesson 3 of 160
In this lesson
- Three directions, three amounts
- The numbers for Wisconsin woods
- When longitudinal shrinkage isn’t small
- Estimating shrinkage at any moisture content
- Volume and weight
- What to take from this
Picking up where you left off.
Three directions, three amounts
Wood is not the same in every direction, and neither is its shrinkage. Picture a log: you can measure along the grain (longitudinal, up the trunk), across the rings from pith to bark (radial), or around the rings, tangent to them (tangential). From green to oven-dry, the Wood Handbook gives these typical ranges 1:
- Longitudinal: 0.1 to 0.2 percent for most species. Practically nothing.
- Radial: roughly 2 to 8 percent.
- Tangential: roughly 5 to 12 percent, usually about twice the radial figure.
The reason lies in the cell structure. The long cells run up the trunk, and their walls are built of cellulose fibrils wound almost parallel to the cell’s length, so they barely shorten as they dry. Across the grain, the walls themselves get thinner as bound water leaves, which shows up as shrinkage. Radial shrinkage is held back partly by the rays, ribbons of cells running from pith to bark that act like stiff spokes, and partly by differences between earlywood and latewood. Tangential shrinkage has no such restraint.
Quick check
Normal wood shrinks only about 0.1 to 0.2 percent along the grain from green to oven-dry, compared with roughly 4 to 11 percent across it.
The numbers for Wisconsin woods
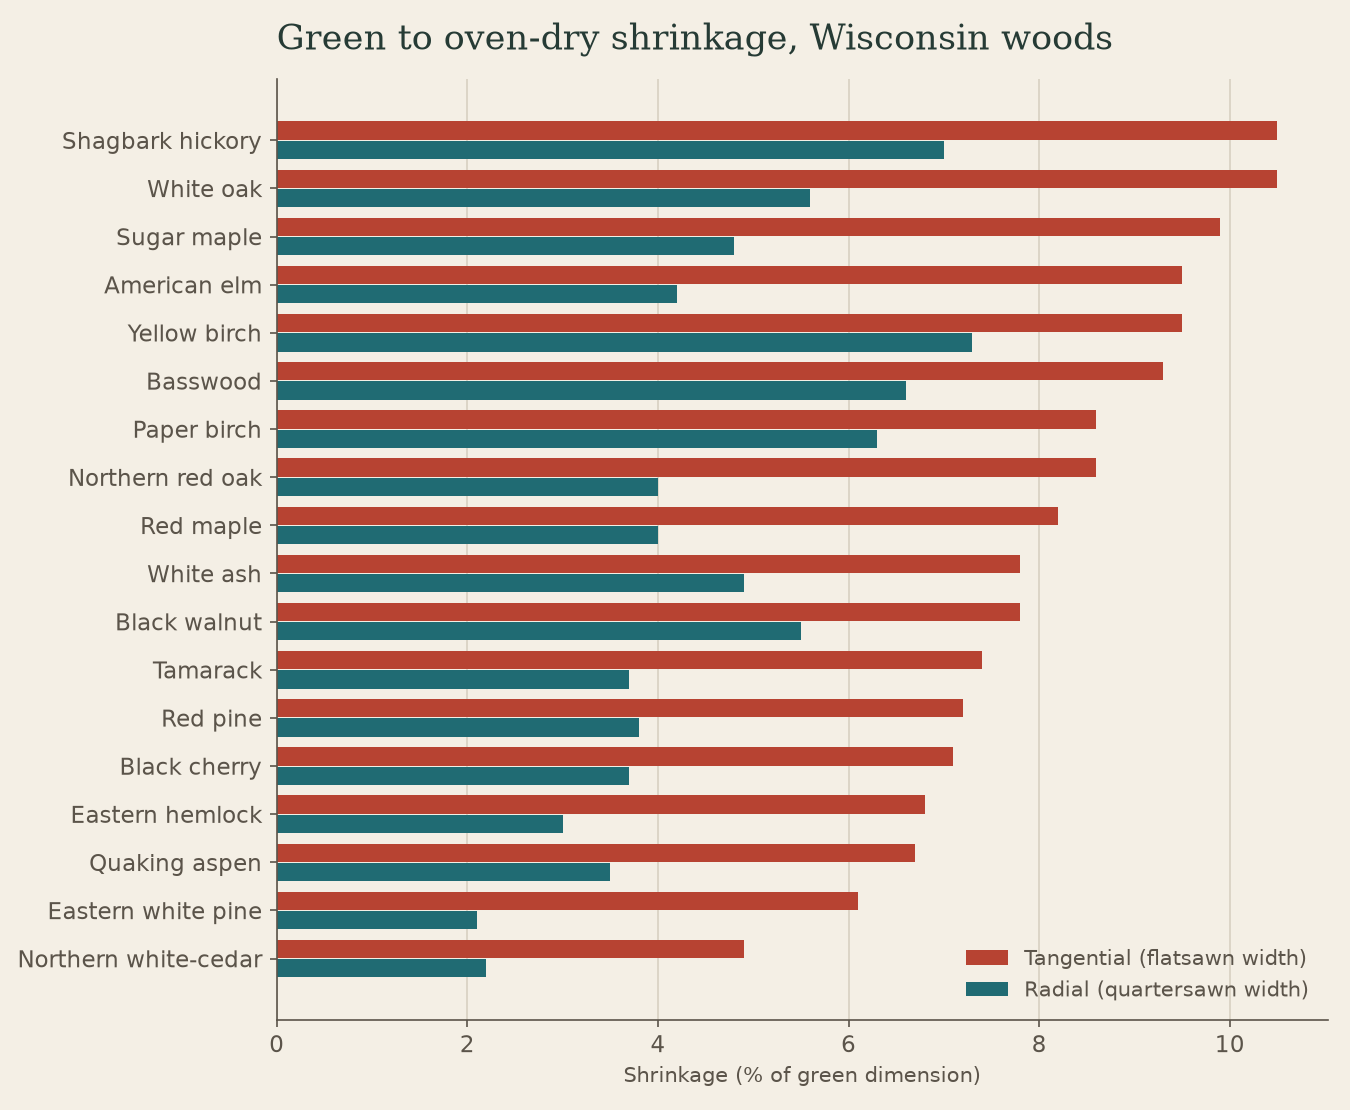
From the Wood Handbook, shrinkage from green to oven-dry as a percentage of the green dimension 1:
| Species | Radial | Tangential | T/R ratio |
|---|---|---|---|
| White oak | 5.6 | 10.5 | 1.9 |
| Northern red oak | 4.0 | 8.6 | 2.2 |
| Bur oak | 4.4 | 8.8 | 2.0 |
| Shagbark hickory | 7.0 | 10.5 | 1.5 |
| Sugar maple | 4.8 | 9.9 | 2.1 |
| Red maple | 4.0 | 8.2 | 2.1 |
| Yellow birch | 7.3 | 9.5 | 1.3 |
| Paper birch | 6.3 | 8.6 | 1.4 |
| Basswood | 6.6 | 9.3 | 1.4 |
| American elm | 4.2 | 9.5 | 2.3 |
| White ash | 4.9 | 7.8 | 1.6 |
| Black walnut | 5.5 | 7.8 | 1.4 |
| Black cherry | 3.7 | 7.1 | 1.9 |
| Quaking aspen | 3.5 | 6.7 | 1.9 |
| Eastern white pine | 2.1 | 6.1 | 2.9 |
| Red pine | 3.8 | 7.2 | 1.9 |
| Eastern hemlock | 3.0 | 6.8 | 2.3 |
| Northern white-cedar | 2.2 | 4.9 | 2.2 |
Read the table two ways. The total tangential number tells you how much a flatsawn board’s width will change. The T/R ratio tells you how much a piece will distort, because distortion comes from the two directions shrinking unequally. Walnut, birch, and basswood, with ratios near 1.4, stay comparatively square and flat. White pine shrinks little in total but has a high ratio, which is why it can still cup.
In general, denser wood shrinks more. Individual pieces vary a lot even within one species: the handbook puts the coefficient of variation around 15 percent, so two red oak boards from the same log can differ noticeably.
When longitudinal shrinkage isn’t small
Three kinds of wood break the “nothing along the grain” rule, and they cause most of the bow and crook you see in drying 1:
- Reaction wood: compression wood on the lower side of leaning softwoods, tension wood on the upper side of leaning hardwoods.
- Juvenile wood from near the pith of some species.
- Cross grain, where the fibers run at an angle to the edge of the board.
These can shrink up to about 2 percent lengthwise. If a board has reaction wood along one edge and normal wood along the other, one edge shortens more than the other and the board bows or crooks. Boards from leaning trees and from the center of the log deserve suspicion.
Estimating shrinkage at any moisture content
You rarely dry all the way to oven-dry, so you need shrinkage at your target moisture content. The handbook’s estimate assumes shrinkage starts at fiber saturation and runs in a straight line to zero moisture 1:
S(x) = S₀ × (1 − x ÷ 30)
where S₀ is the green-to-oven-dry shrinkage from the table, x is the target moisture content, and 30 is the usual fiber saturation value.
Example: a 10-inch-wide flatsawn white oak board, green, dried to 8 percent.
- S(8) = 10.5 × (1 − 8/30) = 10.5 × 0.733 = 7.7 percent
- 10 inches × 0.077 = 0.77 inch narrower.
The same board quartersawn: 5.6 × 0.733 = 4.1 percent, or 0.41 inch. That difference is why quartersawn stock is prized for wide panels and why green blanks are always sawn oversized.
The linear assumption works well for averages of many pieces, not for predicting one board exactly, and in real boards the shell starts shrinking while the core is still above fiber saturation. Use it to size rough stock and to understand trends.
Volume and weight
Volumetric shrinkage, the total loss of volume, runs about 7 percent for cedar to 17 percent for dense oaks and hickory. Meanwhile the wood’s weight drops much more, because most green-wood weight is water that leaves without any shrinkage at all.
What to take from this
Wood shrinks almost nothing along the grain, a moderate amount radially, and about twice that tangentially. Use Table 4-3 for the total, the T/R ratio for how much a piece will distort, and S₀ × (1 − x/30) to estimate shrinkage at your target moisture content. Watch for reaction wood, juvenile wood, and cross grain, which shrink lengthwise and cause bow and crook.
Practice
Assuming shrinkage starts at 30 percent and runs linearly to zero, at 15 percent it is halfway: 5.25 of the 10.5 percent.
Practice
Distortion comes from the difference between tangential and radial shrinkage. Walnut’s T/R ratio of about 1.4 is low, so boards stay flatter and squarer.
Lesson complete
Nice work.
Sources for this lesson
- 1Samuel V. Glass, Samuel L. Zelinka. Moisture Relations and Physical Properties of Wood (Wood Handbook, Chapter 4). USDA Forest Service, Forest Products Laboratory, FPL-GTR-282. 2021. verifiedFree and bound water, fiber saturation (~30%), EMC table (Table 4-2), green moisture by species (Table 4-1), shrinkage by species (Table 4-3), and the shrinkage equation. Cited at: Shrinkage; Table 4-3; Longitudinal Shrinkage; Equation 4-9.
Further reading
- R. Bruce Hoadley. Understanding Wood: A Craftsman's Guide to Wood Technology. Taunton Press. 2000. verifiedThe woodworker's standard on wood structure, moisture, shrinkage, and drying.
Previous: Equilibrium Moisture Content: Wood Follows the Air